Did you know that the first-ever tweet was sent by Twitter CEO Jack Dorsey, way back in 2006? 14 years later, Twitter is still going strong and shows no signs of slowing down. Twitter currently boasts 330 million monthly active users (as of 2019 Q1) of which, 145 million (more than 40 percent), use the platform on a daily basis!
Even with the dawn of new-age video-first platforms like Instagram and Snapchat that have taken the world by storm, Twitter still has its place in the digital landscape.
Brands often find Twitter to be highly rewarding. It has always been a great platform for brands to interact with their target customers and gather insights into what’s trending. While some use it as a customer awareness medium, many use Twitter as a customer service platform.
By jumping into a dialogue and showing the human side of their brand, companies aim to become ‘friends’ with their customers and form meaningful relationships.
Top Twitter Statistics That Will Blow Your Mind
If you are a brand, marketer, or an influencer in this day and age and are not employing or just can’t understand the gigantic opportunity that Twitter has as a customer awareness and branding platform, these Twitter statistics might help!
We have curated a list of some shocking as well as eye-opening Twitter statistics that’ll make rethink your notions about the platform. Go through these stats and plan your marketing strategy accordingly. You ready? Let’s go!
General Twitter Stats:
#1. Twitter has over 330 million monthly active users worldwide.
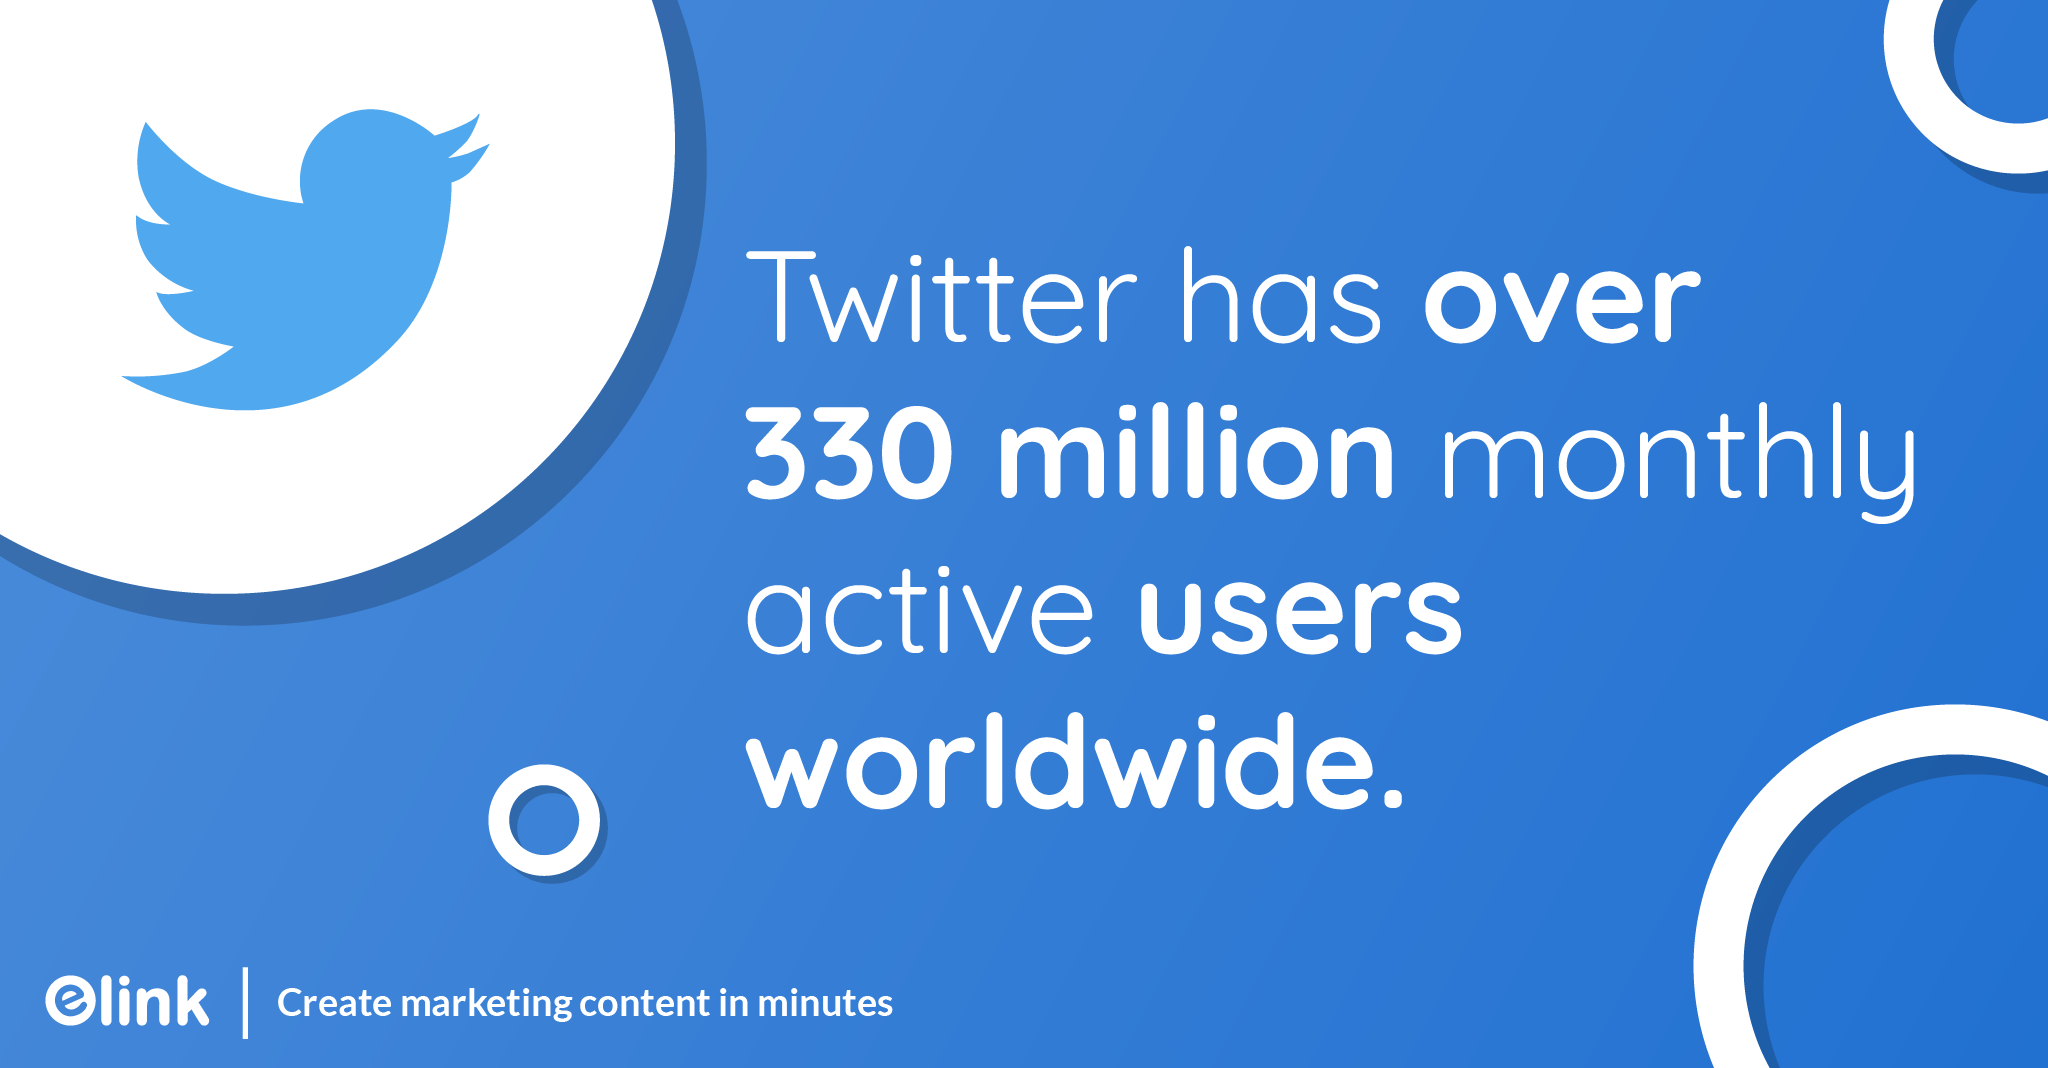
The first question on top of everyone’s mind is how many people around the world use Twitter. Twitter currently has over 330 million monthly active users worldwide. However, stats suggest that roughly 500 million people access Twitter every month without logging into an account, which actually shows that Twitter has a much larger digital footprint then stats actually show.
#2. Twitter had 152 million monetizable daily active users worldwide.
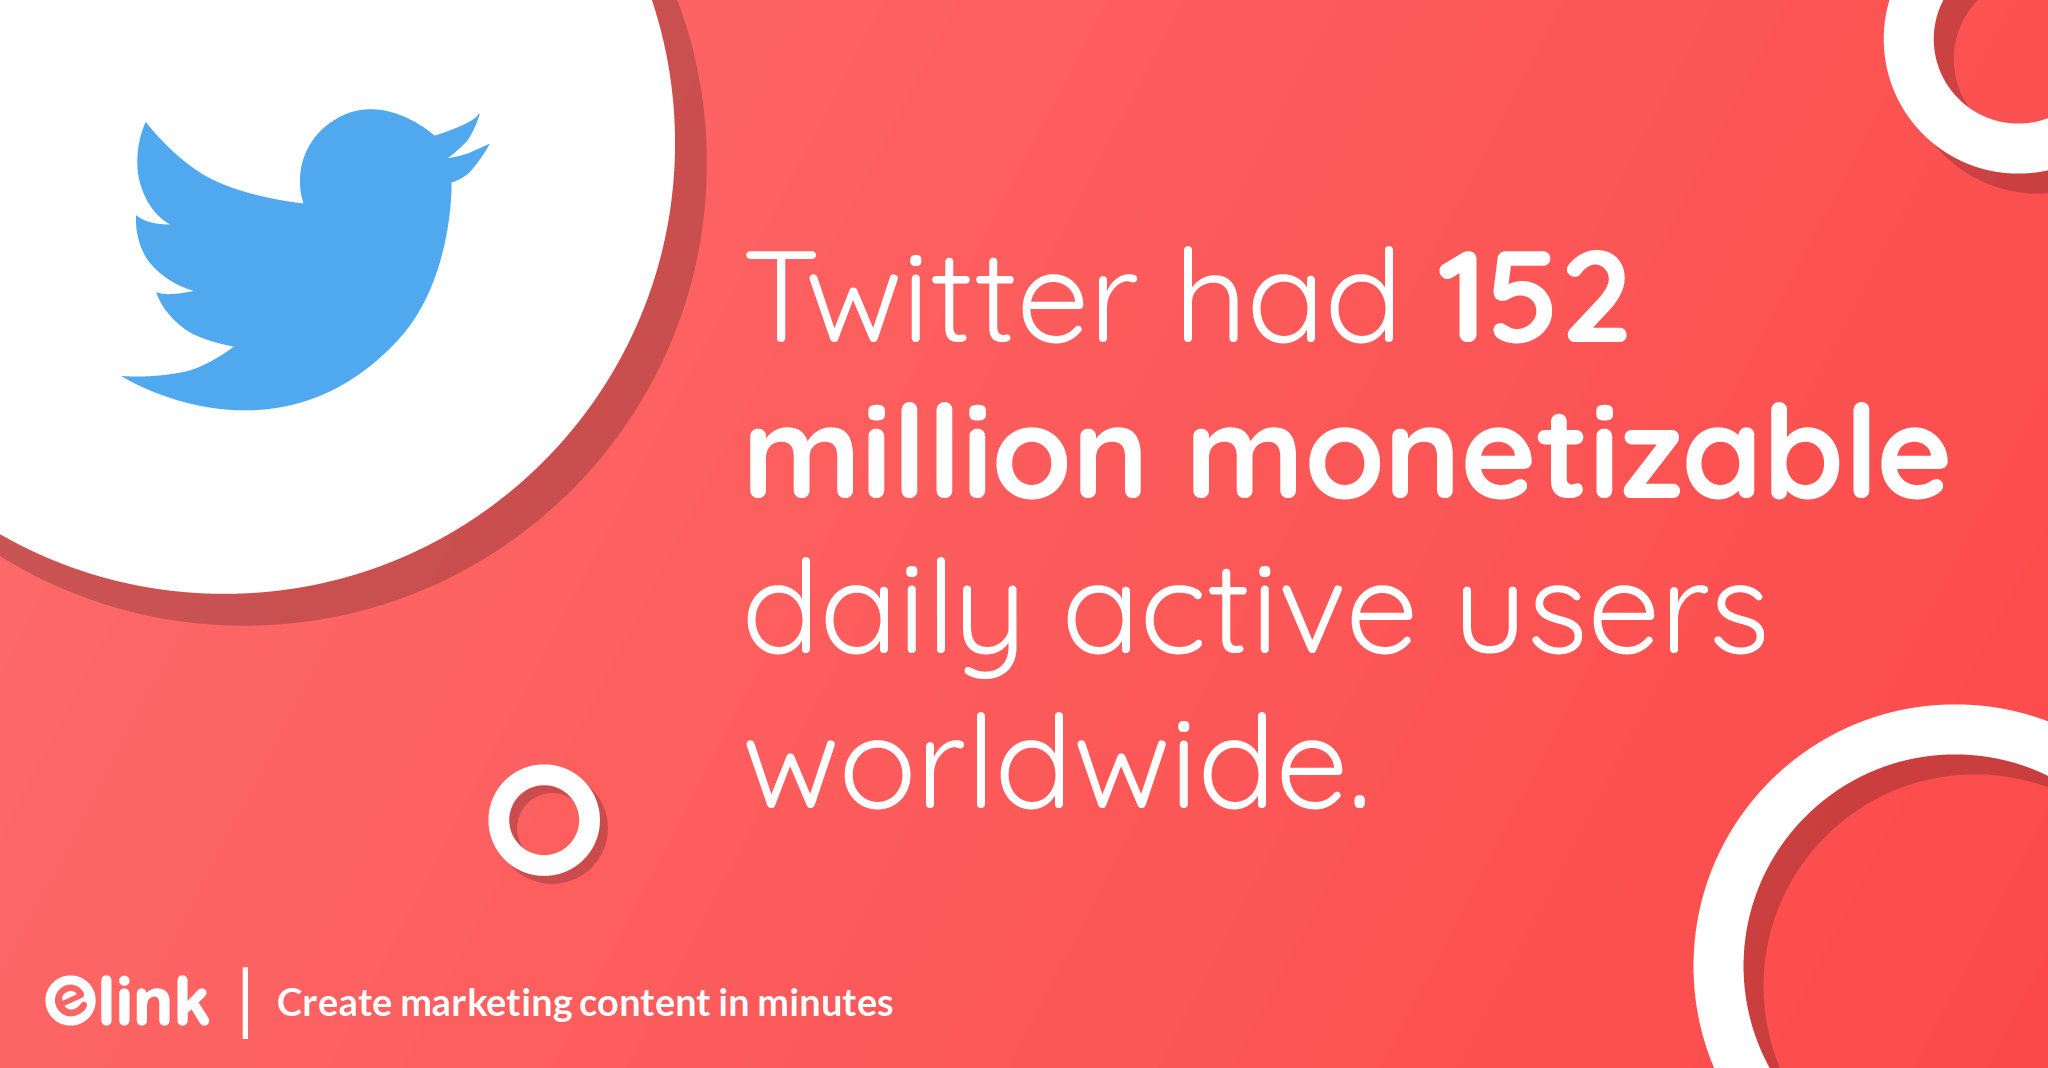
Twitter currently has over 152 million daily active users, a number which is up 17% since Q3 2018, according to Twitter’s Q3 2019 report. For reference, this compares to 124 million in the same period of the previous year and 139 million in the previous quarter. This shows that even with the dawn of new marketing mediums like TikTok and Instagram, Twitter is still showing growth.
#3. Twitter users collectively send 500 million tweets per day.
Every second, on average, around 6,000 tweets are tweeted on Twitter, which means over 350,000 tweets sent per minute, 500 million tweets per day and around 200 billion tweets per year! It’s not easy fo brands and marketers out there to compete with so much noise and get their message across.
Using social media scheduling tools like Hootsuite and Buffer can help you analyze your engagement and provide you with the best time to post on Twitter.
Read More: 27 YouTube Stats That Will Stun Marketers
#4. The average time spent on Twitter is 3.53 minutes per session
The average time spent on Twitter per session is 3.53 minutes. It’s relatively low when compared to Facebook, where a user spends about 4.82 minutes before leaving the app. However, the short timespan of a tweet allows users to Tweet (or retweet their own tweet!) the same thing at different time spans and reach out to different audiences and get more engagement.
People often come to Twitter for their daily news roundup and trending topics that are easy to consume. This explains the shorter time span.
Twitter User Stats:
#5. 59 million of Twitter’s daily users are American.
According to Statista, Twitter remains to be popular in the United States of America as over 59 million (59.35 million to be precise) Twitter users are Americans. Japan and the United Kingdom were ranked second and third with 45.75 and 16.7 million users respectively.
#6. 63 percent of Twitter users worldwide are between 35 and 65 years old
A whopping 6 of every 10 people Twitter users worldwide are between 35 and 65 years old (theVAB, 2018). This clearly shows that Twitter is comprised of a much more mature crowd than Snapchat or even Instagram. This is a crucial stat for marketers and brands who should be diversifying their content and tone on Twitter as opposed to other platforms.
#7. Twitter users in the US are younger and more educated than the rest of the world.
According to findings by PWResearch, Twitter users are much younger than the average U.S adult and are also more likely than the general public to have a college degree.
- The median age of U.S. Twitter users is 40, while the national population is 47.
- 42% of U.S. Twitter users have a college degree, while only 31% of the national population does.
- 41% of U.S. Twitter users report an income above $75,000, while only 32% of the national population does.
#8. 66 percent of Twitter users worldwide are male compared to just 34 percent females.
As it turns out, Twitter users are more skewed towards males than females as around 66 percent of Twitter users are male as compared to only 34% females. In the US, 56 percent of Twitter users are males, as opposed to 44 percent of females. Keep this stat in mind while crafting your next Twitter ad or post.
9. 92% of the U.S. population is familiar with Twitter.
If you are a heavy Instagram user, you must have seen people sharing memes and funny posts from Twitter accounts on Instagram. Even though Twitter has significantly less number of people using it on a daily basis, it still forms a crucial part of the social media ecosystem as tweets are often shared on news websites, blogs, and other social media platforms. This is why almost everyone in the US is familiar with Twitter even if they don’t use it.
Random Twitter Stats
#10. 80% of the Tweets come from 10% of the users!
According to Pew Research, 80 percent of the tweets on the platform are made by 10% of the users in the United States. Members of the top 10% also have different attitudes, behaviors and personal characteristics compared with others.
These prolific tweeters are more likely to be women with 65% of them being women. Also, they are most likely to tweet about politics. Additionally, a median user tweets two times a month on average, while the most prolific Twitter users tweet 138 times.
#11. The top 10% automate their tweets
Social media scheduling tools like Buffer and Hootsuite have gained popularity in the past few years. Especially with the top 10% of Twitter users as roughly 25% of highly prolific tweeters automate their tweets using software, compared with only 15% of Twitter users in the bottom 90%, according to Pew Research.
#12. 😂 is the most-used Emoji in Tweets!
The “Face With Tears of Joy” emoji is the most popular on Twitter and has been used more than two billion times on Twitter. On average, 75% of the emojis on Twitter are positive and 25% are negative, which shows you the general mood of the audience there. Unsurprisingly, the average usage of positive emojis on Friday and Saturday is 77.7%. On every other day, it’s 76.2% – a 1.9% decrease.
Twitter Stats for Businesses
#13. Twitter users are more likely to like inclusive brands.
According to a recent study by Twitter and IPG, half of the people on Twitter (50%) think brands can become more culturally relevant by being inclusive, and that number rises to 60% among Twitter users.
The study also found that 47% of Twitter users prefer culturally relevant brands and that consumers are more supportive of brands that play a philanthropic role
#14. 40% of Twitter users made a purchase based on a tweet.
Wondering how influential Twitter can be in terms of selling? Well, 4 in 10 Twitter users carried out a purchase after having come across it on the platform! This is great news for brands and marketers as you can be assured that the time you invest in building relationships on the platform has some monetary value as well!
#15. Influencers on Twitter are driving sales!
When we think of influencers, our minds immediately go to Instagram. However, Influencers are making waves on Twitter as well. A report by Twitter shows that those who were exposed to brand Tweets had a 2.7x lift in purchase intent over participants who did not see an advertiser Tweet. When participants were exposed to a campaign that featured both brand and influencer Tweets, the lift in purchase intent more than doubled to 5.2x.
#16. 77% of Twitter users feel more positive about a brand when their Tweet has been replied to.
Creating compelling content should be the number one priority for any brand or marketer on social media. However, engaging with your audience, especially those who comment or DM (direct message), is an important part of the equation that most brands ignore.
A staggering 77% of Twitter users feel more positive about a brand when their Tweet has been replied to. If you can create a positive image of your brand in your prospect’s mind, they are much more likely to buy from you than your competitor.
Twitter Advertising Stats
#17. Video advertising is taking off on Twitter.
Thanks to faster and cheaper internet plans, video consumption has increased multifold in the past few years. Twitter is no exception as the platform sees over 2 billion video views on Twitter each day, which is 67% YoY growth according to Twitter’s internal data.
Since video consumption, as well as engagement, is huge online, using video ads on Twitter can be a game changer for your brand. According to stats, Tweets with video attracted 10x more engagements than Tweets without video. Promoted Tweets with videos save more than 50% on cost-per-engagement. The message is clear- post more videos on Twitter!
#18. Twitter users spend 26% more time with ads than other social media users.
Speaking of ads, Twitter also claims that it’s the best platform for online advertisement as users spend 26% more time with ads than other social media users! Twitter has been a great content discovery platform for years, which may be the reason why people are willing to spend more time engaging with an ad on Twitter than on any other social media platform.
Read More: Ultimate Guide To Your Twitter Header Size and Cover Photo
#19. Twitter users spend 24% more time with ads created by Influencers.
Twitter partnered with Magna and IPG Media Lab on a study that showed that Twitter users spend 24% more time with ads that come from creators, as opposed to those posted directly by brands. Twitter is pushing hard to show brands the value of influencer marketing on their platform. If you have experience with influencer marketing, it looks like a decent bet to work with a Twitter creator for your next marketing campaign.
#20. 93% of video views that happen on Twitter happen on a mobile device.
Twitter calls itself a mobile-first platform and content has always been mostly consumed on mobile devices. A whopping 93% of video views that happen on Twitter happen on a smartphone.
If you are looking to create videos for more reach and engagement, it goes without saying that it should be optimized for mobile devices. A good rule of thumb is to keep the video short as people often get distracted on their phone with notifications and might switch to another platform if your video is too long.
#21. Ads are doing better on Twitter as ad engagement is up 23%.
According to Twitter’s Q3 2019 report, Total ad engagements increased 23%, leading to increased click-through rates and a reduced cost per ad engagement. The CPE (cost per engagement) is down 12%. Ads on Twitter are getting cheaper and more engaging, making it a lucrative platform for marketing.
Final Words
Being one of the pioneers of the social media era, Twitter should not be taken lightly by brands, marketers, as well as influencers. After seeing all of these statistics, you really can’t deny the incredible marketing capabilities Twitter has. If you are a marketer or business owner in 2020, Twitter is THE place for customer engagement and brand awareness.
By checking out what’s trending, your brand can quickly tweet timely content and get noticed by a plethora of users worldwide. Since the average life span of a tweet is quite low, we would advise you to use a social media scheduling app like Buffer, Tweetdeck, Falcon.io, etc. to schedule your tweets on different days and times and see what works best for your audience. Lastly, try and incorporate videos in your tweet feed and ad campaigns as they are known to perform better than text and images.
Hope these Twitter statistics will push you to get creative with your Twitter strategy and take your business to newer heights!
Further reads:
25 Insane Instagram Stats that Will Shock You
Twitter Hack: How to Add Multiple Web Links on Your Twitter Bio
The Ultimate Guide To Marketing Collateral
Top Facebook Statistics Every Marketer Must Now
Don’t want to forget this information?
elink it for future reference!
